|
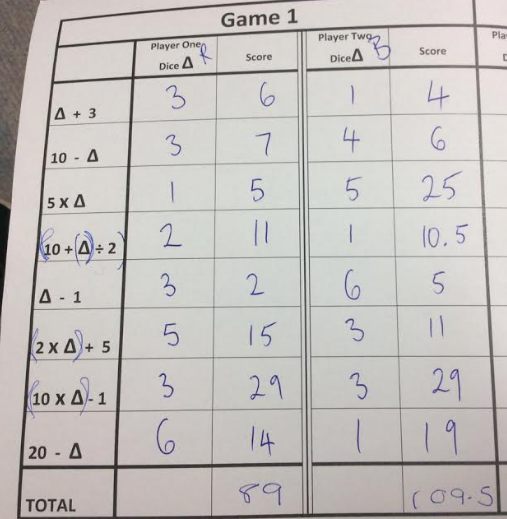
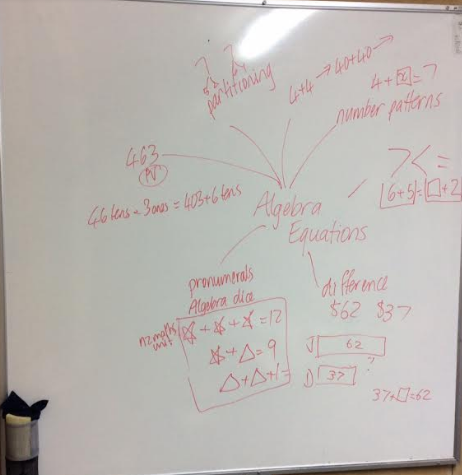
When launching an activity that will take at least a week - think about what big ideas does the task involve. You need to think about what you need to provide the children to launch into it? Do they need some key teaching before starting the task? It could be that they need to see physical objects of what is in the task e.g. 4x4, MDF, etc. Reflection at the end of a maths session is paramount. What have you learned? How will this help? Dice Algebra Game
Writing equations - starting with material 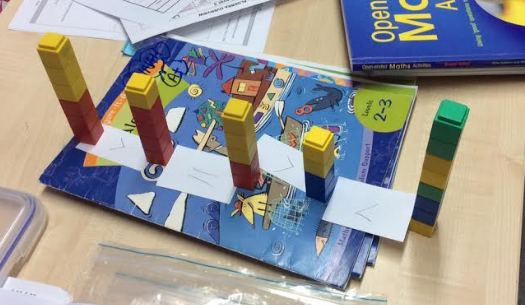 The balance scale can be used to help demonstrate this. 3+2=1x2+3 (Different number of parts) 16=8+2 (Start with =) Use the number to suit the needs of the kids. Difference E.g. $62 - $37 Using bar models to change this to this $37 + ? = $62 256-143=? 256 = 143 + 7 + 50 + 65 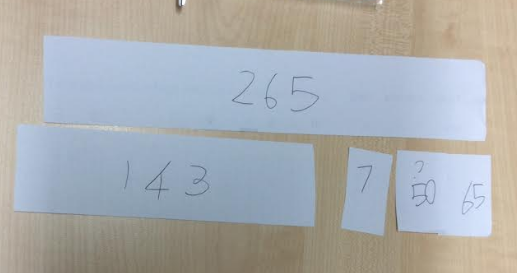
0 Comments
Have 3+ kids to draw a table - Make $11 How many different ways can you split this money. What strategies could you use to do this?
Example Question: What would the biggest climbing box that you could make for $100:
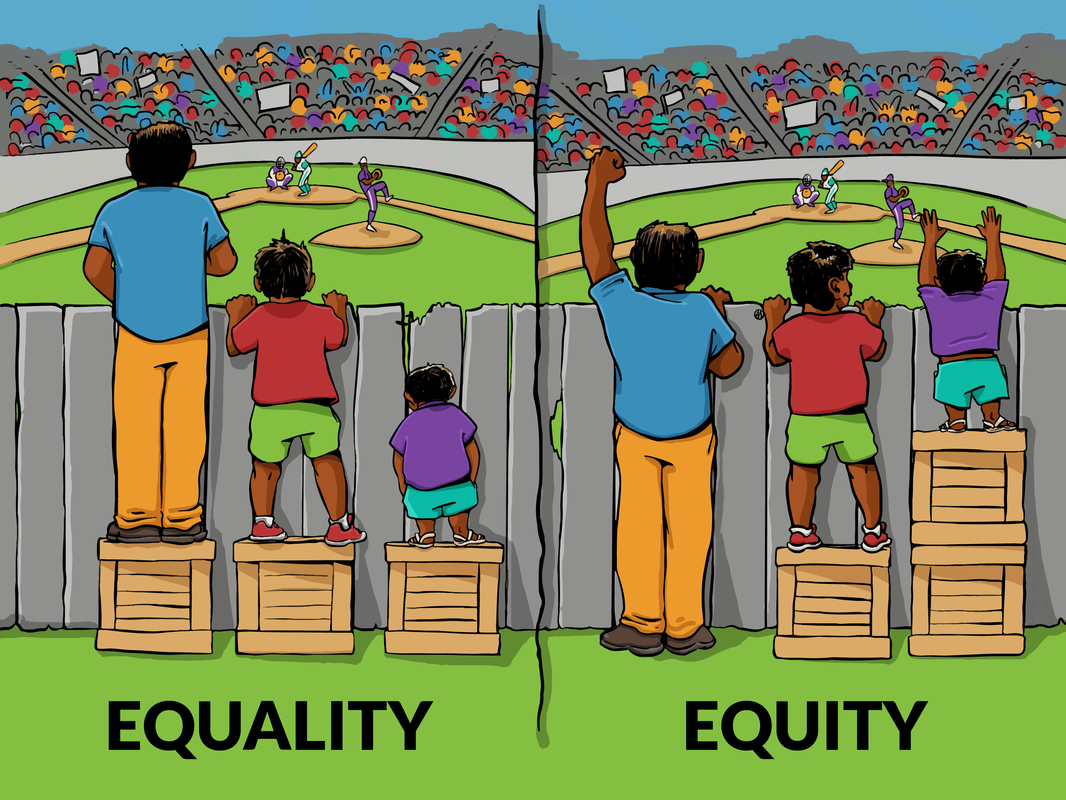
This task is rich & will last for a week. Launching into a challenging learning. Scaffolding (but not over). When sharing work - start with the most simple thinking to the more complex. That way everyone has a voice. StatisticsWe teach statistics - not graphs!
Getting kids to interpret and make sense of data - not teaching how to make a pie graph. It is when to use which graph and interpreting the data. Order of teaching Statistics:
Day 1 Draw a graph to show my favourite ... Would we see a progression with this from Year 1-6? If you took bar graphs out, how else could you do it? Ideas Link with Science Investigations. Arbs FIO Give data - draw graph or vice versa. Great statistical literacy. Average/mean, median, mode etc. is also covered during statistical literacy. Link with division. Looking for trends - make comparisons. Statistics has to have a purpose for collecting the data. Why are you collecting data on eye colours? We need a big problem. Investigation Use shot glass & beans to ask the set of questions. Each colour represents another question. Then sort the shot glasses into questions. Put the data together. What does this data tell you? Sequence of teaching graphing - Photograph each stage to display
Ask another group of students the same questions. Compare data. Building Shapes with Sticks Using match sticks/straws make 3D shapes. Don't model & show - get the children to have a go. Stop every so often to ask questions & tell - How many sticks will you need? These are the edges - edges is the maths language. How many edges? How many bits of blutack do you have? These are vertices. Point to your shape - count your edges, vertices, faces, vertical, horizontal, pryamid, prism, etc. Link to 2D - by unfolding to make it into a net. While do these activities add to language list - parallel, congruent, adjacent, perpendicular, opposite, vertices, edges, faces, etc. Describe your shape using at least 3 of these words from our list. When using straws - cut by mapping the length - how many edges are the same length. You get more out of not being finished. How many vertices do you have? Reply: Ask question back - What are vertices? I need think time. I need talk time. Foil Fun Feedback from this lesson:
 Instructional videos for all are on the website.
Shapes
Travel Rolls
Sequence
Because no students at our school have done this programme, we will need to all start at level 1. We will adjust the lessons and pace to suit the needs of our students.
Embed PDF notes
Establishing Safety -
|
Older Posts
October 2018
Categories
All
|


 RSS Feed
