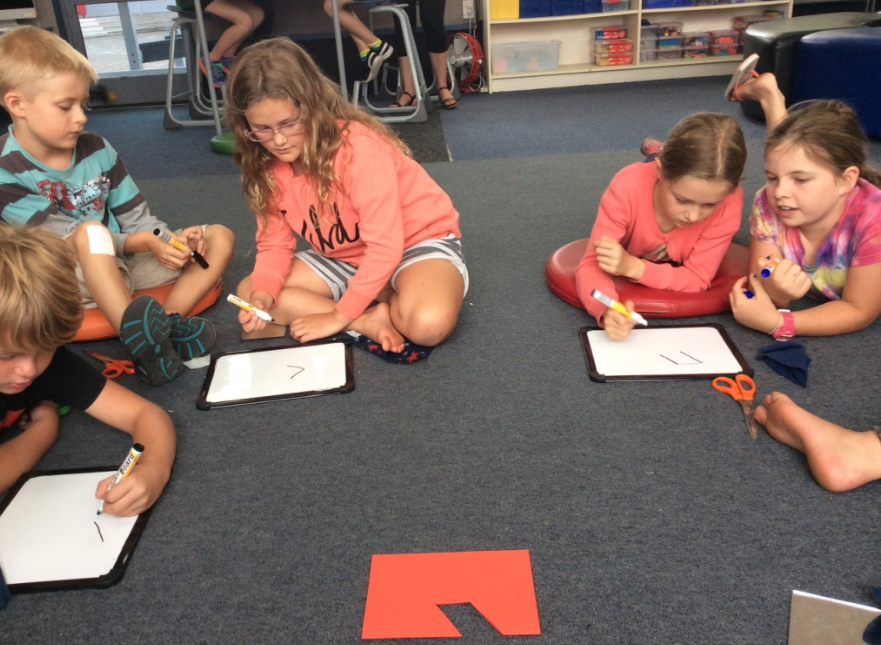
 Fold it Cut it lesson. - During this lesson I only managed to get through the introduction where I cut a shape on a folded piece of paper and they had to predict what it would look like opened up. We worked on:
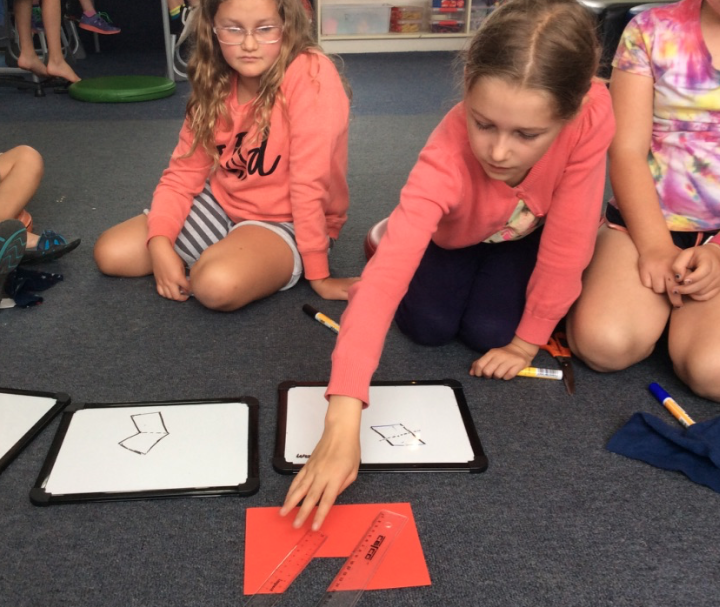 Today the focus was to predict and communicate the results of translations, reflections, and rotations on plane shapes.
My Next Learning Steps:
0 Comments
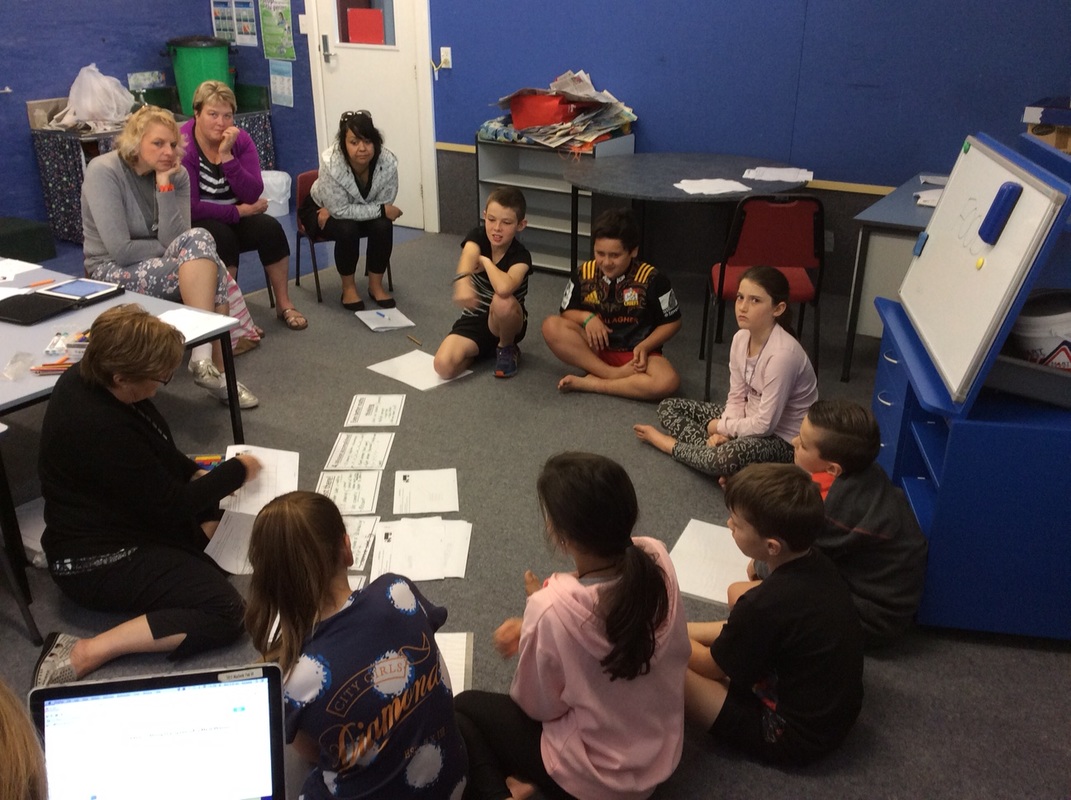
Modelling of a rich task and anticipating responses.
Although stage 5 students can do some tasks with fractions, students need to have mastered that the big idea - You need to know the size of the one. 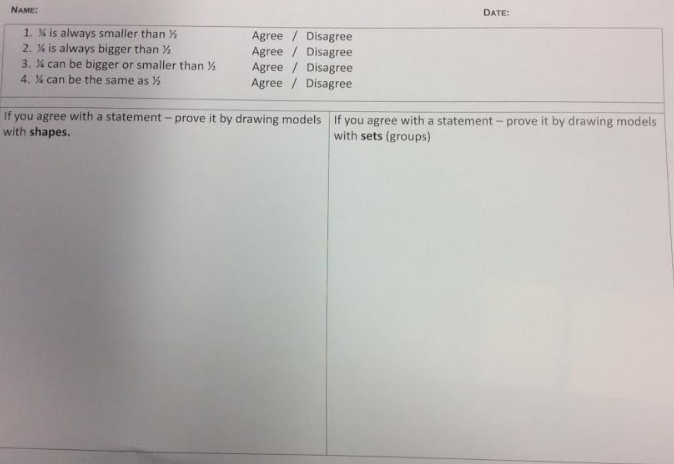
First Steps has great overviews which has everything you need to teach. Data squares for parent night - Have a range of sets of data to sort, different ways of sorting venn diagrams and tables, labels, sample hypothesis, etc. Parents & kids sit down and have a go at sorting the data & reflecting on their hypothesis. Have another go with a different hypothesis. Have a sample template for parents to take home to make their own for their families with their own questions.  Science is a great way of linking stats - looking at data - not necessarily looking at graphs.
Using a strip to proportionally graph where 20 cube flicks went for each pen. They can then easily be made into a box and whisker graph to compare pens/cubes.
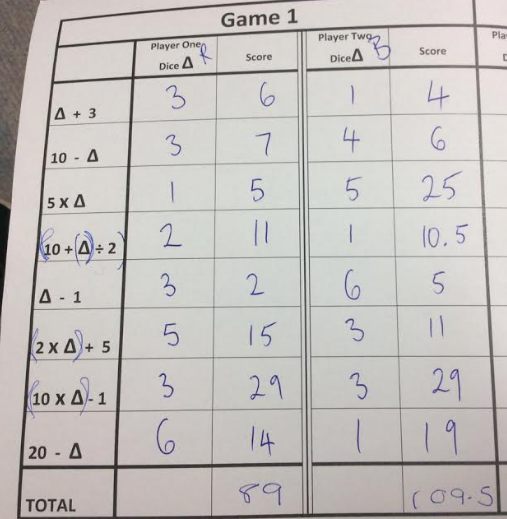
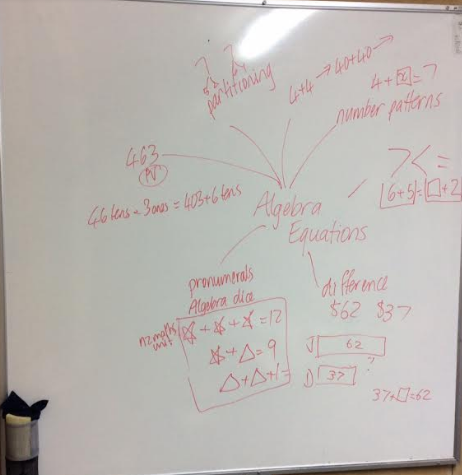
For earlier stages, kids could have numbers up the side with shot glasses up the side to put the cube. Use coloured squares/multi link cubes, beads to show graph, data, then a strip graph, then a pie graph. When launching an activity that will take at least a week - think about what big ideas does the task involve. You need to think about what you need to provide the children to launch into it? Do they need some key teaching before starting the task? It could be that they need to see physical objects of what is in the task e.g. 4x4, MDF, etc. Reflection at the end of a maths session is paramount. What have you learned? How will this help? Dice Algebra Game
Writing equations - starting with material 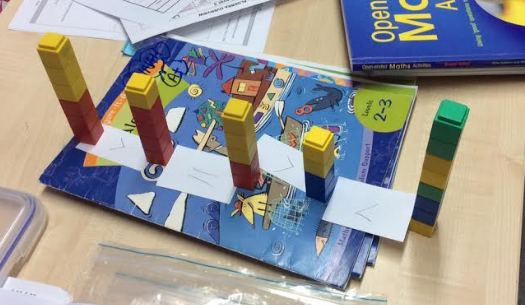 The balance scale can be used to help demonstrate this. 3+2=1x2+3 (Different number of parts) 16=8+2 (Start with =) Use the number to suit the needs of the kids. Difference E.g. $62 - $37 Using bar models to change this to this $37 + ? = $62 256-143=? 256 = 143 + 7 + 50 + 65 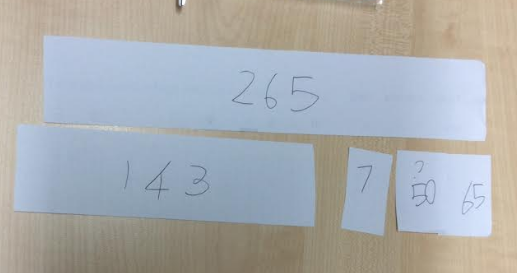 Have 3+ kids to draw a table - Make $11 How many different ways can you split this money. What strategies could you use to do this?
Example Question: What would the biggest climbing box that you could make for $100:
This task is rich & will last for a week. Launching into a challenging learning. Scaffolding (but not over). When sharing work - start with the most simple thinking to the more complex. That way everyone has a voice. StatisticsWe teach statistics - not graphs!
Getting kids to interpret and make sense of data - not teaching how to make a pie graph. It is when to use which graph and interpreting the data. Order of teaching Statistics:
Day 1 Draw a graph to show my favourite ... Would we see a progression with this from Year 1-6? If you took bar graphs out, how else could you do it? Ideas Link with Science Investigations. Arbs FIO Give data - draw graph or vice versa. Great statistical literacy. Average/mean, median, mode etc. is also covered during statistical literacy. Link with division. Looking for trends - make comparisons. Statistics has to have a purpose for collecting the data. Why are you collecting data on eye colours? We need a big problem. Investigation Use shot glass & beans to ask the set of questions. Each colour represents another question. Then sort the shot glasses into questions. Put the data together. What does this data tell you? Sequence of teaching graphing - Photograph each stage to display
Ask another group of students the same questions. Compare data. Building Shapes with Sticks Using match sticks/straws make 3D shapes. Don't model & show - get the children to have a go. Stop every so often to ask questions & tell - How many sticks will you need? These are the edges - edges is the maths language. How many edges? How many bits of blutack do you have? These are vertices. Point to your shape - count your edges, vertices, faces, vertical, horizontal, pryamid, prism, etc. Link to 2D - by unfolding to make it into a net. While do these activities add to language list - parallel, congruent, adjacent, perpendicular, opposite, vertices, edges, faces, etc. Describe your shape using at least 3 of these words from our list. When using straws - cut by mapping the length - how many edges are the same length. You get more out of not being finished. How many vertices do you have? Reply: Ask question back - What are vertices? I need think time. I need talk time. Foil Fun Feedback from this lesson:
Dinah Staff Meeting
Generic to all measurement
Need to
It is about getting students to articulate the complete measurement sentence. The essences of all measurement- How many fit? If you are doing a rubric - the task needs to be richer - which can show progress. Closed tasks = just teach Use rubrics once during a unit- this is only 1 of our tools. Next step: Use a starter plan to organise a 10 minute starter each day. This would benefit all of my students. It is important that there is diversity in the task and this is also helps to maintain learning. Teaching Measurement Lesson with DinahFeedback from JoyNotes from observation notes -Watching Joy Teach
Well done Joy - It was a great lesson. I enjoyed watching & I got a lot out of it. Here are my notes from your lesson.
P.S. Great questions Questioning - Joy & Dinah
Brenda's key learning from observing lesson:
Teaching Area using Invisible Squares
At Russell Street School we follow the Japanese Inquiry Model - Jugou Kenkyuu. Below are our scripts, notes & reflections.
Lesson Taught In Own Class
After perfecting our lesson I taught it to my class. I was blown away with the strategies my Year 3 & 4 students were using. Straight away they filled the shapes with blocks and started counting the squares.
Feedback from Dinah
Throughout the lesson ask - what are you measuring? with what? how many?
Keep reinforcing the language - no gaps, no over lays & Area Reduce wording on rubric Invisible squares - scaffolding - see photos below This book below is great for supporting/beginning to use rubrics in maths. *I need to find our school copy 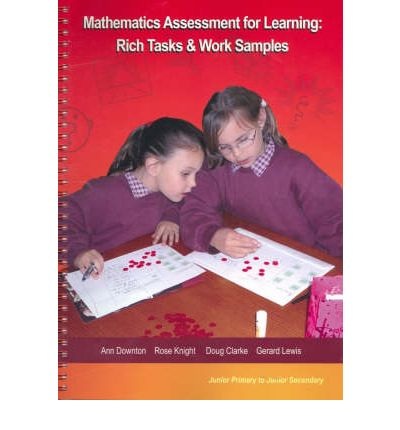 Below is what we ANTICIPATED the kids might come up with:
Praise the children for putting their work at the right level. Ask "How could you get to the next level? Who could you ask?
This stage 5-10mins max.
 A task like this should only be done once per unit and during an application task only. For the amount of time spent on a task like this, ensure that it targets a few of the big ideas.
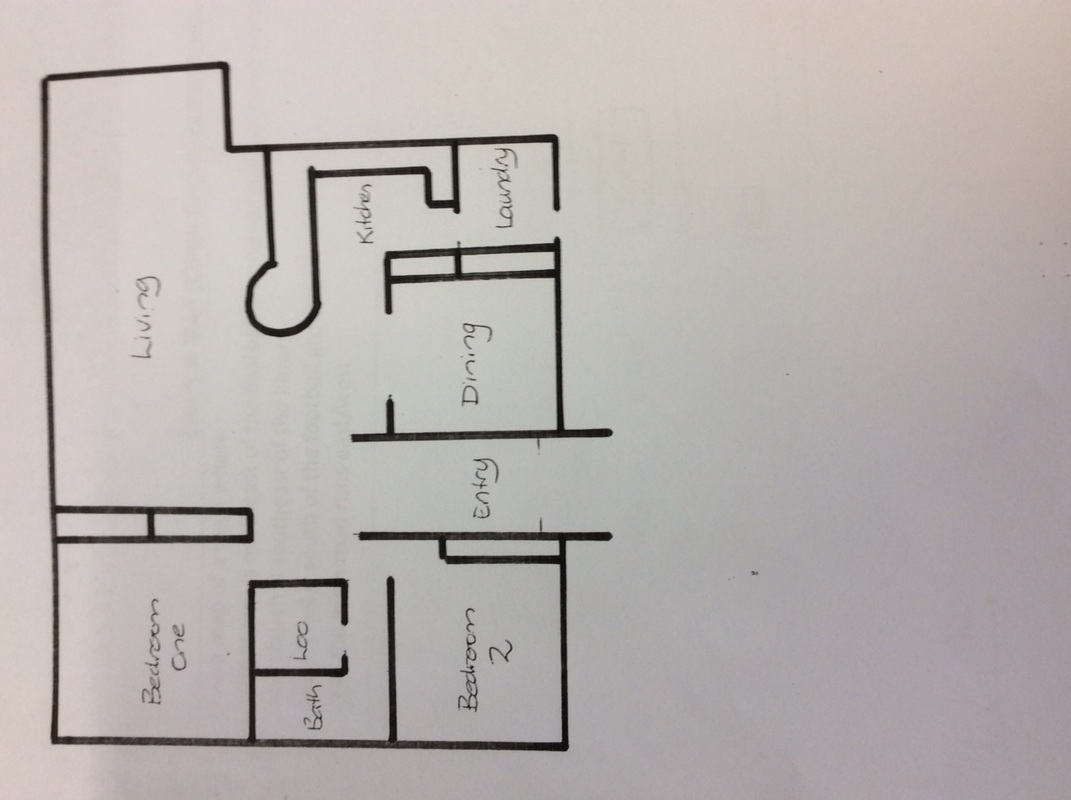
Draw a map for a __ year old. Give small squares for students to draw symbols. (All draw) Select 1 to draw on the map. By the end of the modeling session we have a class map & all students have a pile of symbols for their own maps. Estimate the gap - how many cubes. Then check the stack on the map. This can lead into teaching scale. Design a bedroom using 42m2 (Using dot paper/grid paper). TO DO - Put compass app on ipads & ipods for next term. |
Older Posts
October 2018
Categories
All
|
||||||||||||||||


 RSS Feed
